2020 was a wild ride! We had the COVID-19 pandemic, which upended most of our lives, and now housing prices have gone through the roof. According to the Wall Street Journal, Billings, Coeur d’Alene and Spokane are in the top five hottest home markets in the United States. In Montana, there have been concerns about a housing shortage and the inability of working families to find reasonably priced homes, as well as concerns about homelessness. Are these concerns related to COVID-19 migration?
Recent media stories suggest a connection. For example, a Wall Street Journal series paints a scenario where the pandemic has changed the migration patterns of young affluent workers away from crowded urban centers and toward less populated areas. Could this contribute to rising demand for housing here in Montana?
If the year was 2023 or 2024 we could definitely answer this question. Detailed IRS and U.S. Census Bureau data would be available and we could concretely quantify the effects the COVID-19 pandemic had on recent migration. We could also identify certain important demographic characteristics, such as age and income of the migrants. Unfortunately, it will be a while until these figures become available.
In the meantime, there is one data source that provides an up-to-date partial picture of migration. The U.S. Postal Service (USPS) records the requests for changes of address and United States Commercial Real Estate Services (CBRE), a national real estate research firm, publishes data on people moving from one location to another for each Metropolitan Statistical Area (MSA). Montana has three MSAs – Billings, Missoula and Great Falls. Unfortunately, fast growing Bozeman and Kalispell have not yet been designated as an MSA.
The good news is that this data is very timely. The figures include all of 2020, so the impact of COVID-19 will be captured. The bad news is that the data is not very detailed or complete. For instance, we do not know if a request for an address change involves a family or a single individual. Also, USPS redacts data for individual source-destination combinations if there is the possibility that individuals could be identified. This means there are states and/or cities for which there are no data. It appears that redacted data also includes those with 10 or less entries.
In any case, the figures for 2019 and 2020 are comparable and analyzing them allows one to see the changes in migration between those years. Tables 1 and 2 present change of address data for Montana’s three MSAs, compiled by the state and MSA of origin or destination.
These data were compiled by CBRE and their report on migration patterns emphasizes national trends. The authors also supplied data for Montana’s relatively small and rural cities. As was mentioned, state or MSA totals cannot be calculated, because the USPS redacted many of the source-destination pairs in the interest of confidentiality.
Table 1 presents the changes of address between Montana cities and other states. The first thing to notice is that the number of address changes in-state dwarfs those for out-of-state locations. For example, the 11,455 address changes to Missoula or from elsewhere in Montana was roughly 45 times larger than the next largest number of 486 for Washington. This illustrates the concept long held by demographers that people, when they move, do not move very far.
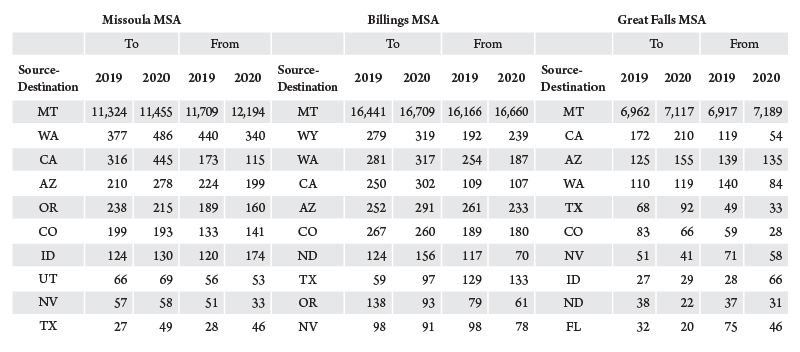
Table 1. Requests for address changes, Montana and selected cities. Source: United States Postal Service as tabulated by United States Commercial Real Estate Services.
Secondly, migration paths are a two-way street. States that are major sources of in-migrants are also major destinations for out-migrants.
Thirdly, the geographical orientation of Montana’s three Metropolitan Statistical Areas can be clearly seen in the data. Missoula is in the western part of the state, with Washington as the largest source-destination. Billings has a more Midwest view, with Wyoming as the largest source-destination. Finally, Great Falls looks more Southwest, with migration from California and Arizona.
Finally, there appears to be no major shift in address changes between the pre-COVID year 2019 and the pandemic year of 2020 – this may be a slightly positive trend favoring in-migration. Glancing at the figures, there appear to be minor increases of those moving to Missoula and small decreases of those moving out. But it is not appropriate to extrapolate, because there are about 40 states that are not reported in the data.
Large numbers of people moving in and moving out do not mean significant changes in population. Again looking at Missoula and Washington, hundreds of people moved in and moved out, but the net changes were relatively small; -62 in 2019 (377-440=-62) and +146 in 2020 (486-340=146).
Table 2 presents the address changes tabulated by MSAs in the West. As with states, much of the data for cities has been redacted to preserve confidentiality. We cannot compute overall totals.
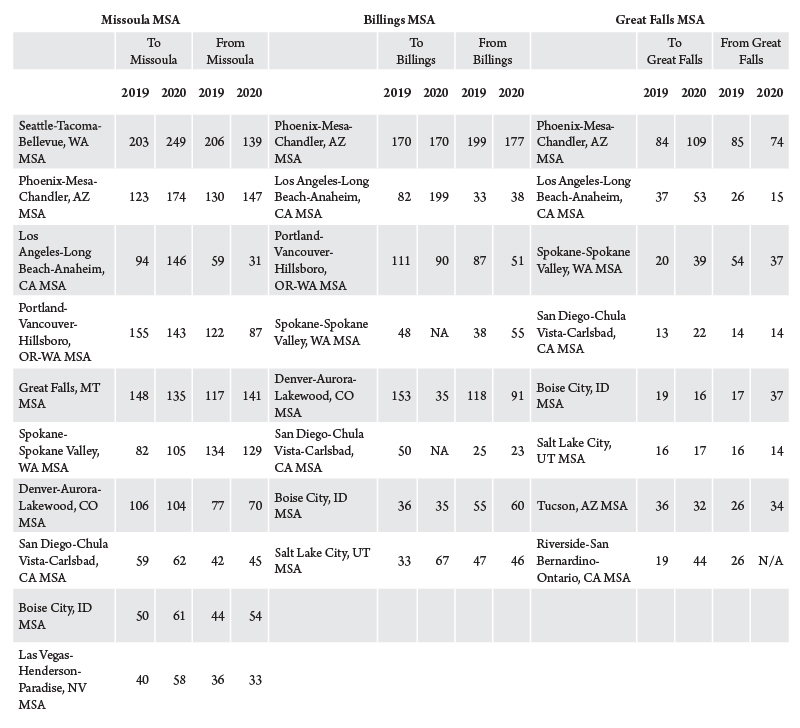
Table 2. Requests for address changes, Montana MSAs and selected cities. Source: United States Postal Service as tabulated by United States Commercial Real Estate Services.
For the most part, these data reflect the features of the state figures. Migration is two-way – large number in incomers is matched by a significant out migration with little net change. The number of movers, even for the largest cities, is relatively small. Most of the figures being in the tens or hundreds, even for the largest cities.
These city tabulations directly address the issue of whether there has been a flight from cities associated with COVID-19. The short answer is probably not, or at least not very much. There was no shift in mobility patterns and source-destination cities remained in the same rank in both 2019 and 2020. The data presented in Table 2 may show a slight tendency toward increased net in-migration, but we really don’t know because of the large number of redactions.
In summary, it will be years until accurate migration data becomes available. The changes of address collected by the USPS are up-to-date but incomplete. These data suggest there has been no major COVID-19 related changes in mobility between 2019 and 2020. There may have been a very slight rise in net in-migration, but nowhere near large enough to cause Montana’s significant house price inflation. We will have to look elsewhere for the explanation.
To view the full United States Commercial Real Estate Services report on resident migration patterns, click here.